

In Part 1: National Housing Trends, our recap of the past decade indicated that the United States continues to experience a large housing shortage since household construction fails to keep up with household formation. To supplement this, much of our follow-up research showed which metros get hit the hardest and uncovered important implications for our home market, San Diego, CA. This analysis, we hope, provides more fuel for the discussion on what should be done about housing supply and affordability, a situation that continues to worsen.
Fundamentals
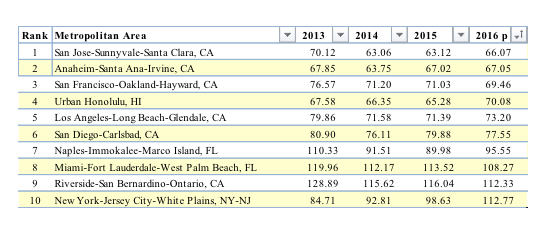
Poor housing affordability rests at the intersection of high demand and low supply, the poster child being our very own home state of California. Per the most recent 2016 Census data and The National Association of Realtors Housing Affordability Index, 4 of the top 5, and 6 of the top 10 least affordable MSA’s are located in CA (4 in southern CA). This index shows median family income as a percentage of the income needed to qualify for the median-priced homes with a 20% down payment. Said another way, in 2016, a San Diegan’s median family income was only 78% of the amount needed to qualify for the average priced home.
Besting national unemployment trends of 3.2% as of March 2018, San Diego’s job creation engine and the resulting household formation stand as proof that the city remains a desirable location to live and work.
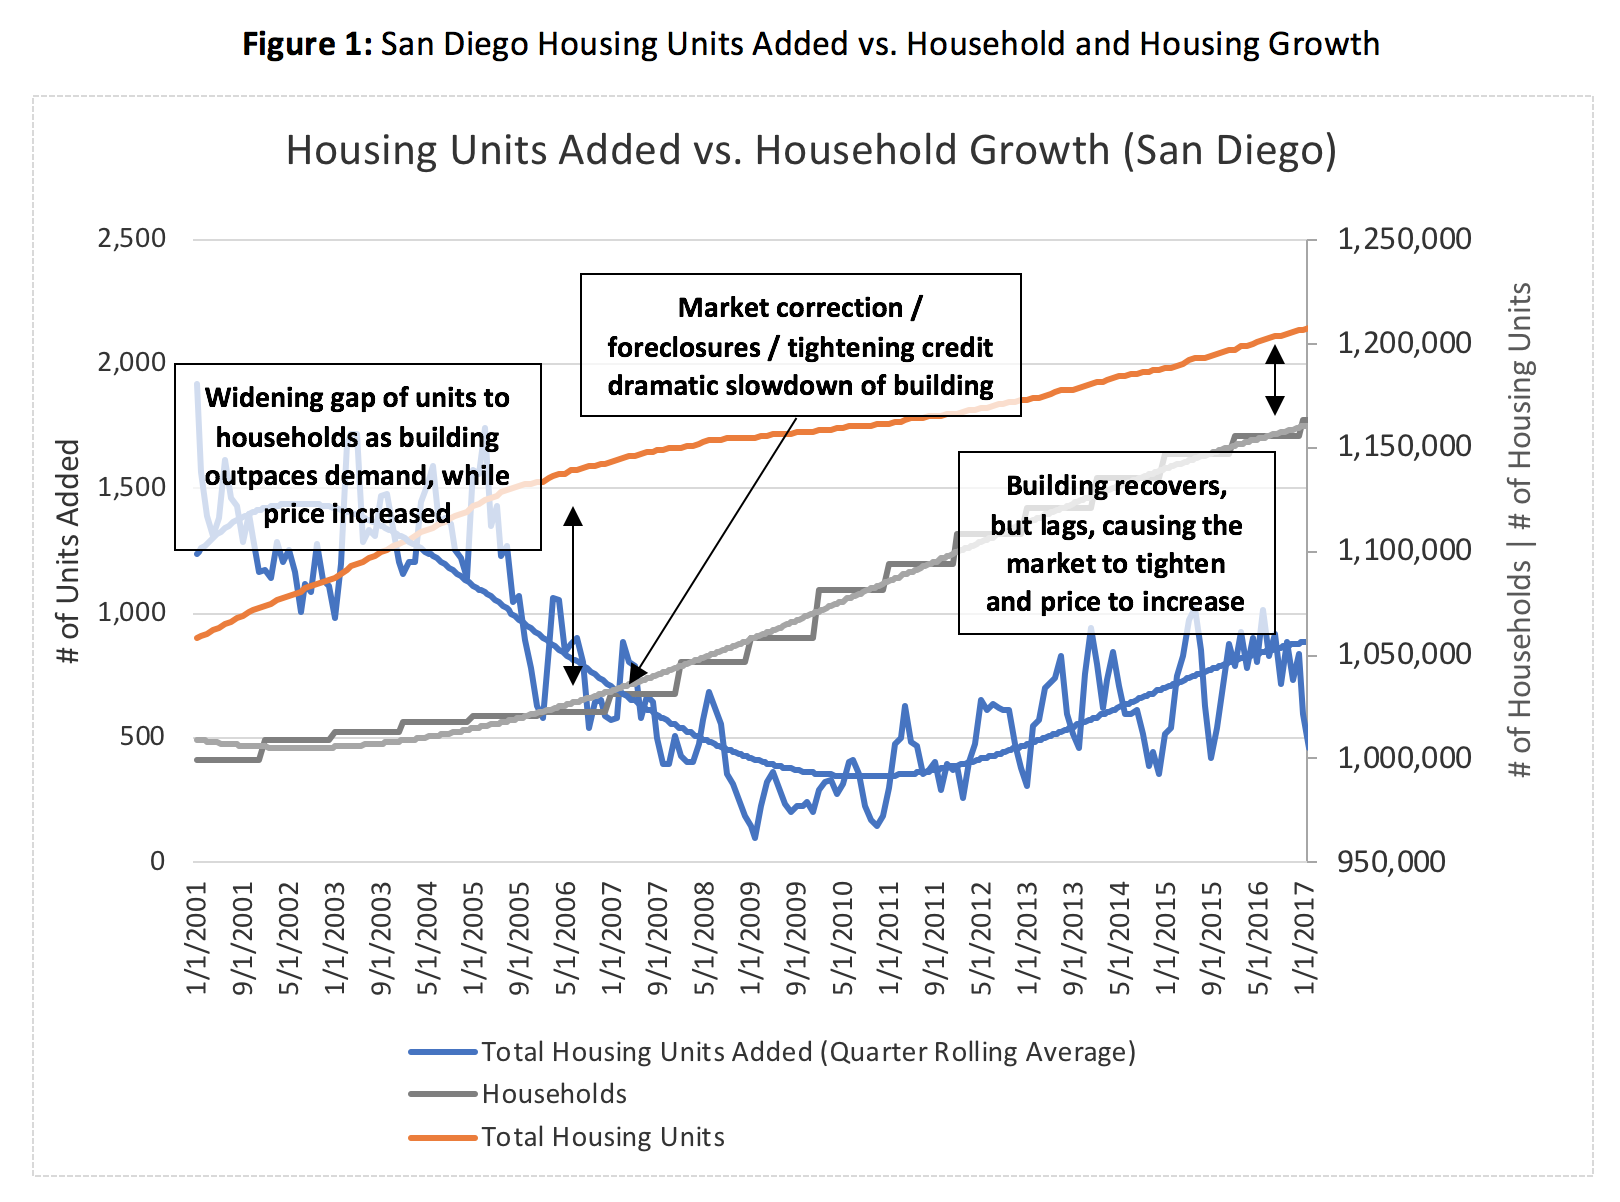
Figure 1, below, Federal Reserve economic data shows the dynamics in play between the number of housing units added to the market and household formation. San Diego mirrors the national trend, but with a greater number of households as a % of available housing units. Measured in terms of housing unit occupancy, approximately 96% of housing units were occupied in San Diego by 4Q 2017, compared to 92% nationally, pushing prices and rents upwards. By comparison, in 2008 household occupancy was approximately 91% in San Diego and 89% nationally, showing a steady increase as supply lags.
Demand > Supply
This trend is expected to continue for the foreseeable future. A recent update from the CoStar research group compares housing starts on a much longer timeline, from 1984 to 2016 (Figure 2), and overlays household growth for the past decade (Figure 3), offering further support for this mismatched growth.
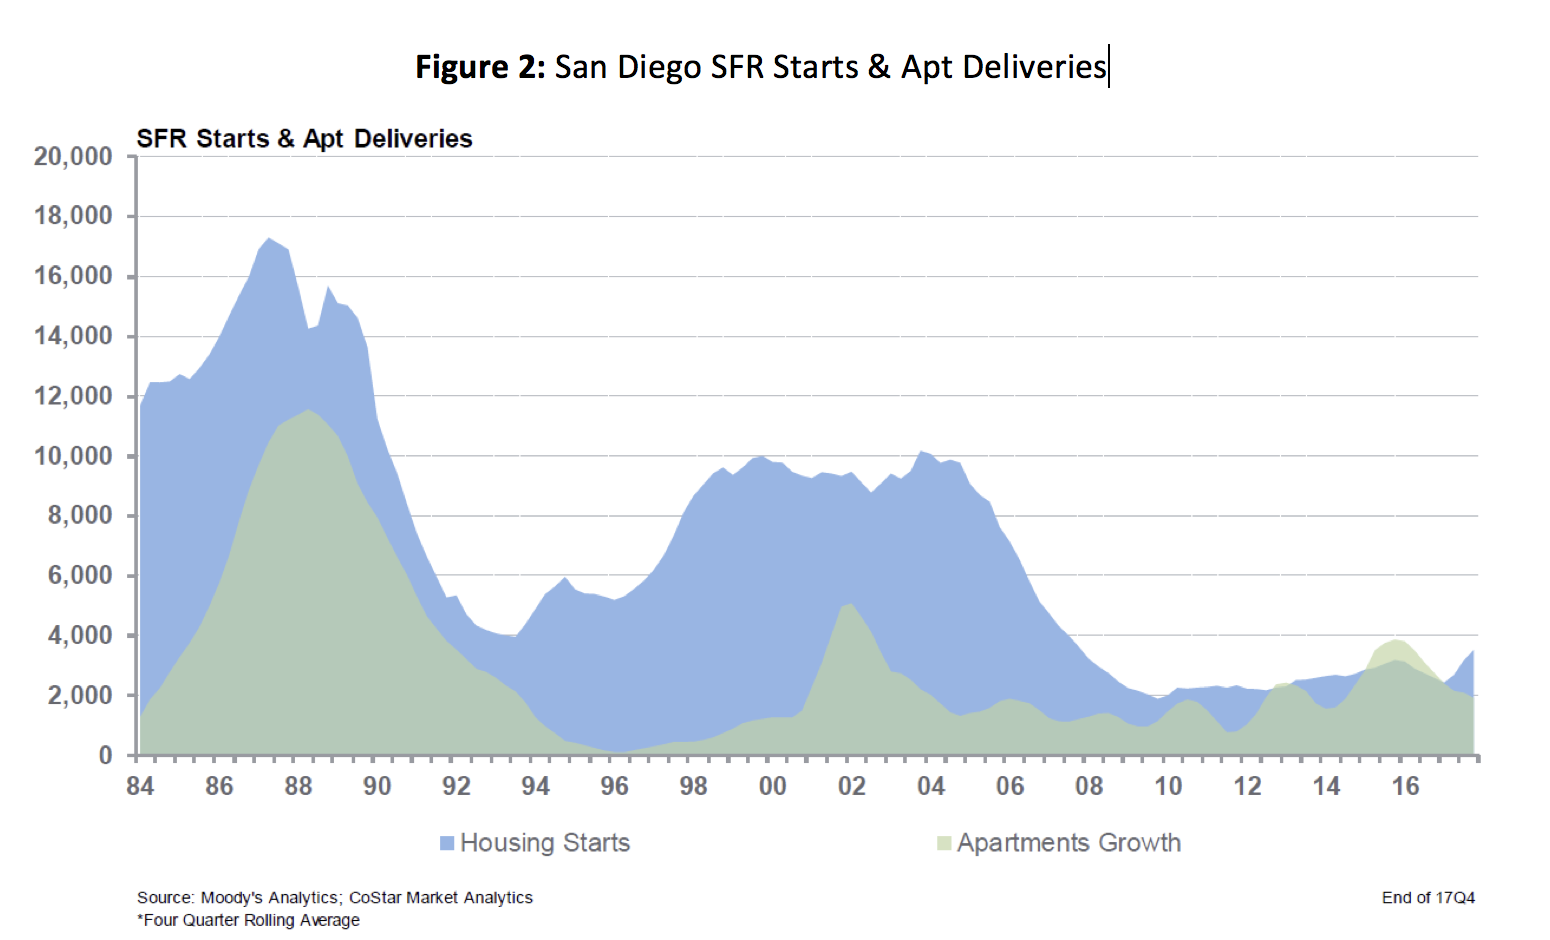
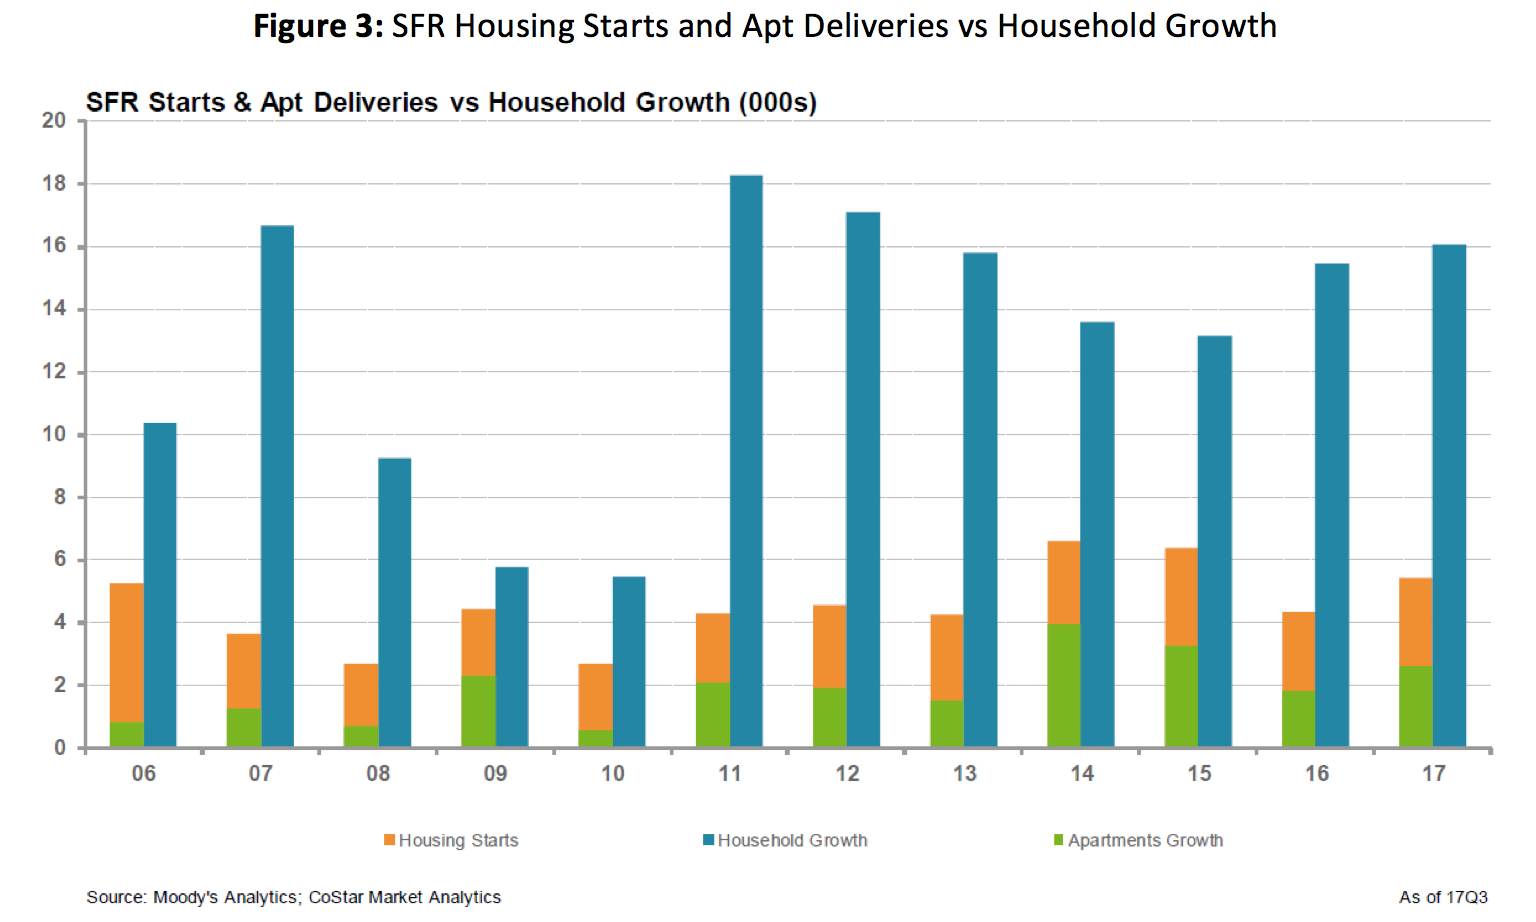
There is historically low building activity, a shortage when compared to household growth, and a greater emphasis on apartments. The homes that do exist are expensive, and not enough new product can be delivered to alleviate pressure from natural and job-driven household formation.
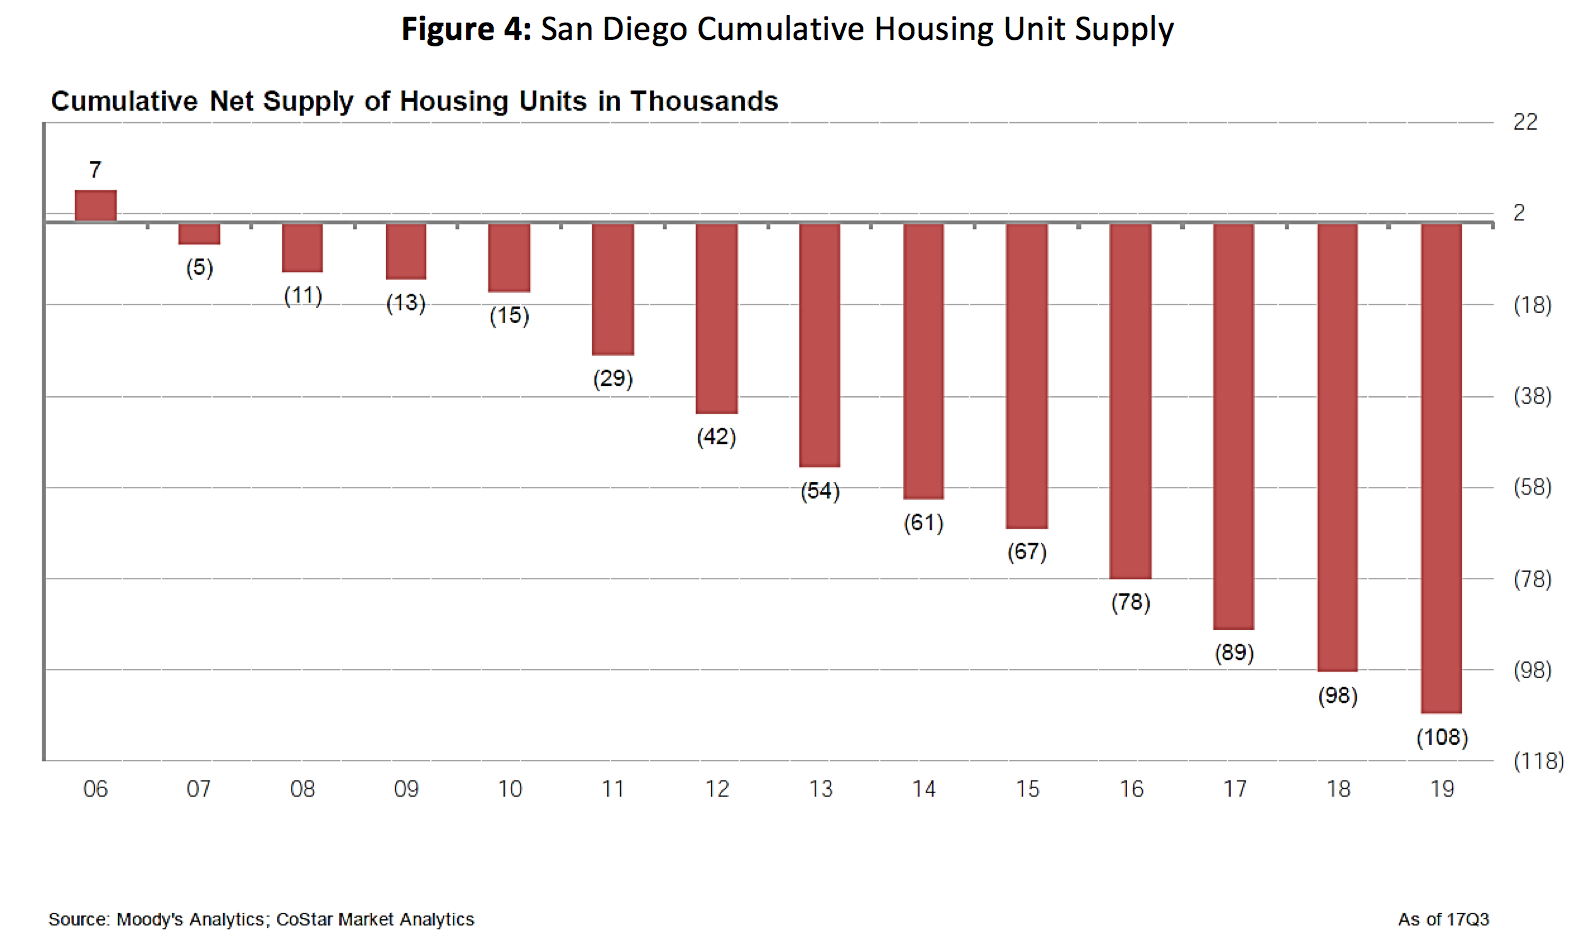
This crunch is being felt across the spectrum. Despite a hot sellers’ market with the average home on the market for 40 days, selling your starter home usually means buying another. Given current valuations, that can be prohibitive, and first-time buyers who delay transitioning into a move-up home create a bottleneck, preventing the new first-time buyer from entering the owners market. It’s estimated that there is currently a shortfall of more than 100,000 housing units in San Diego (Figure 4).
Financial Implications
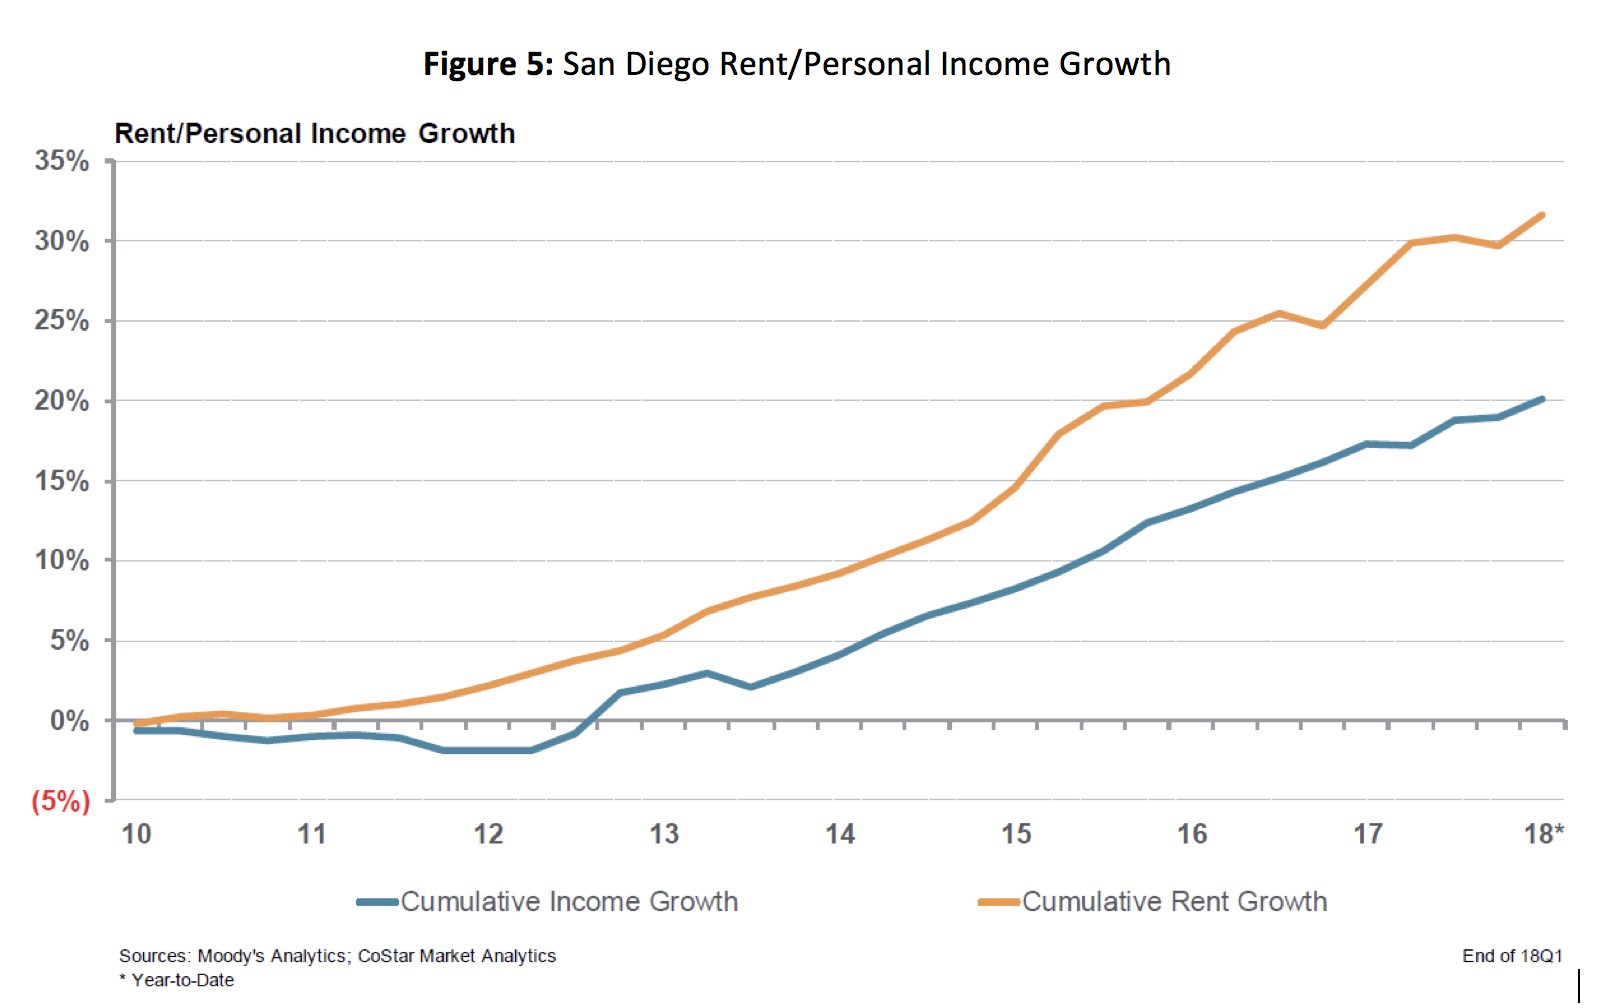
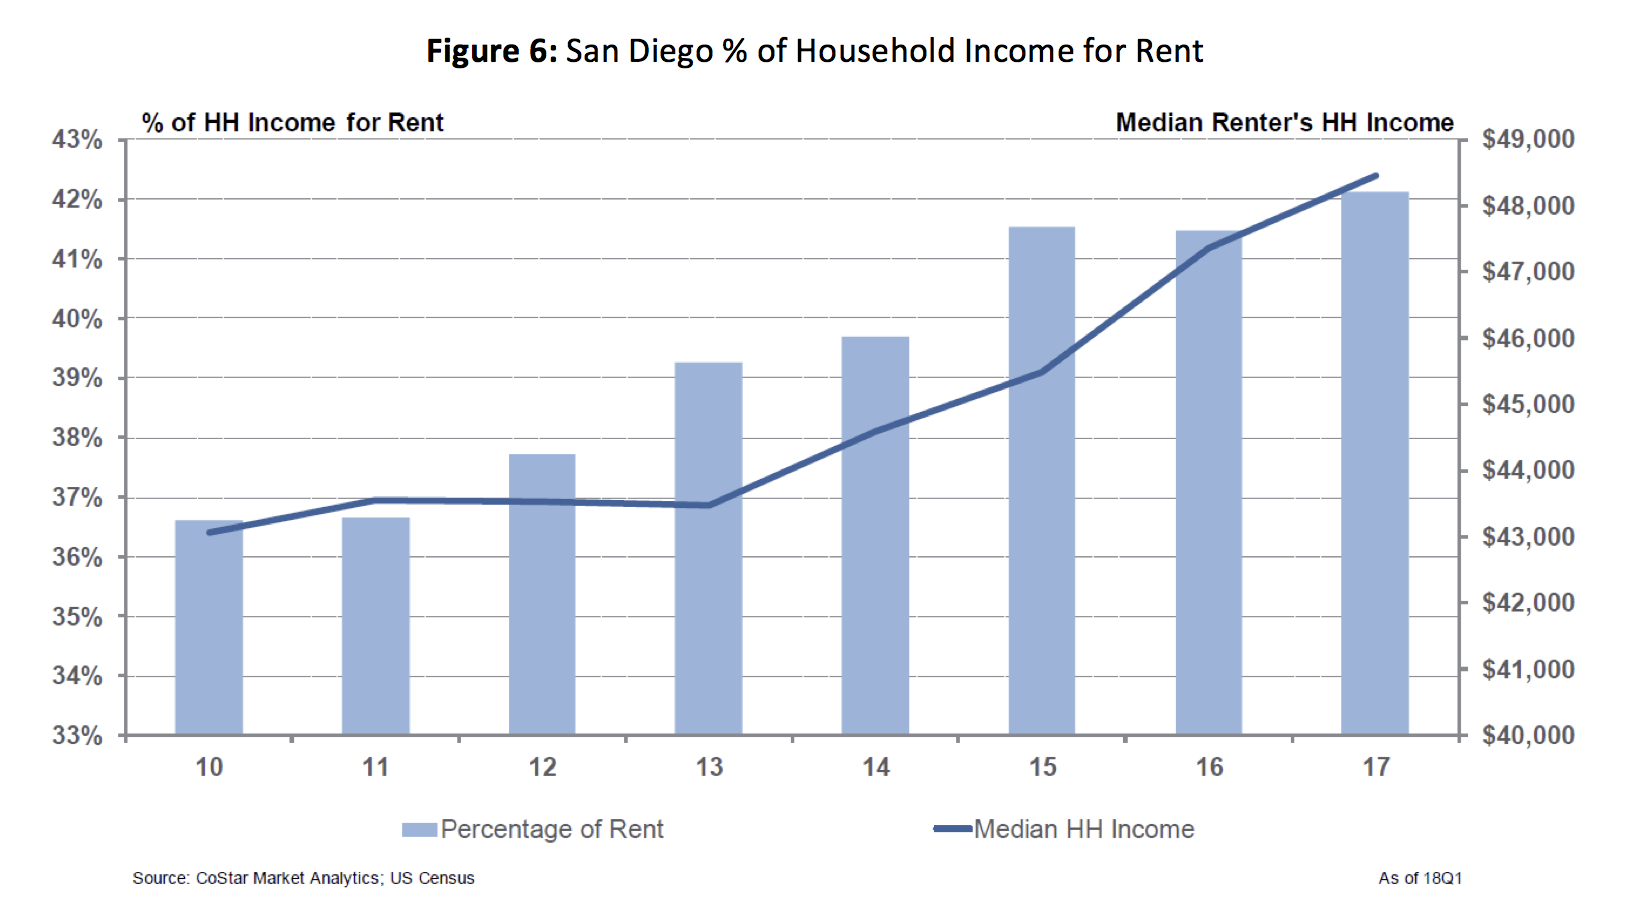
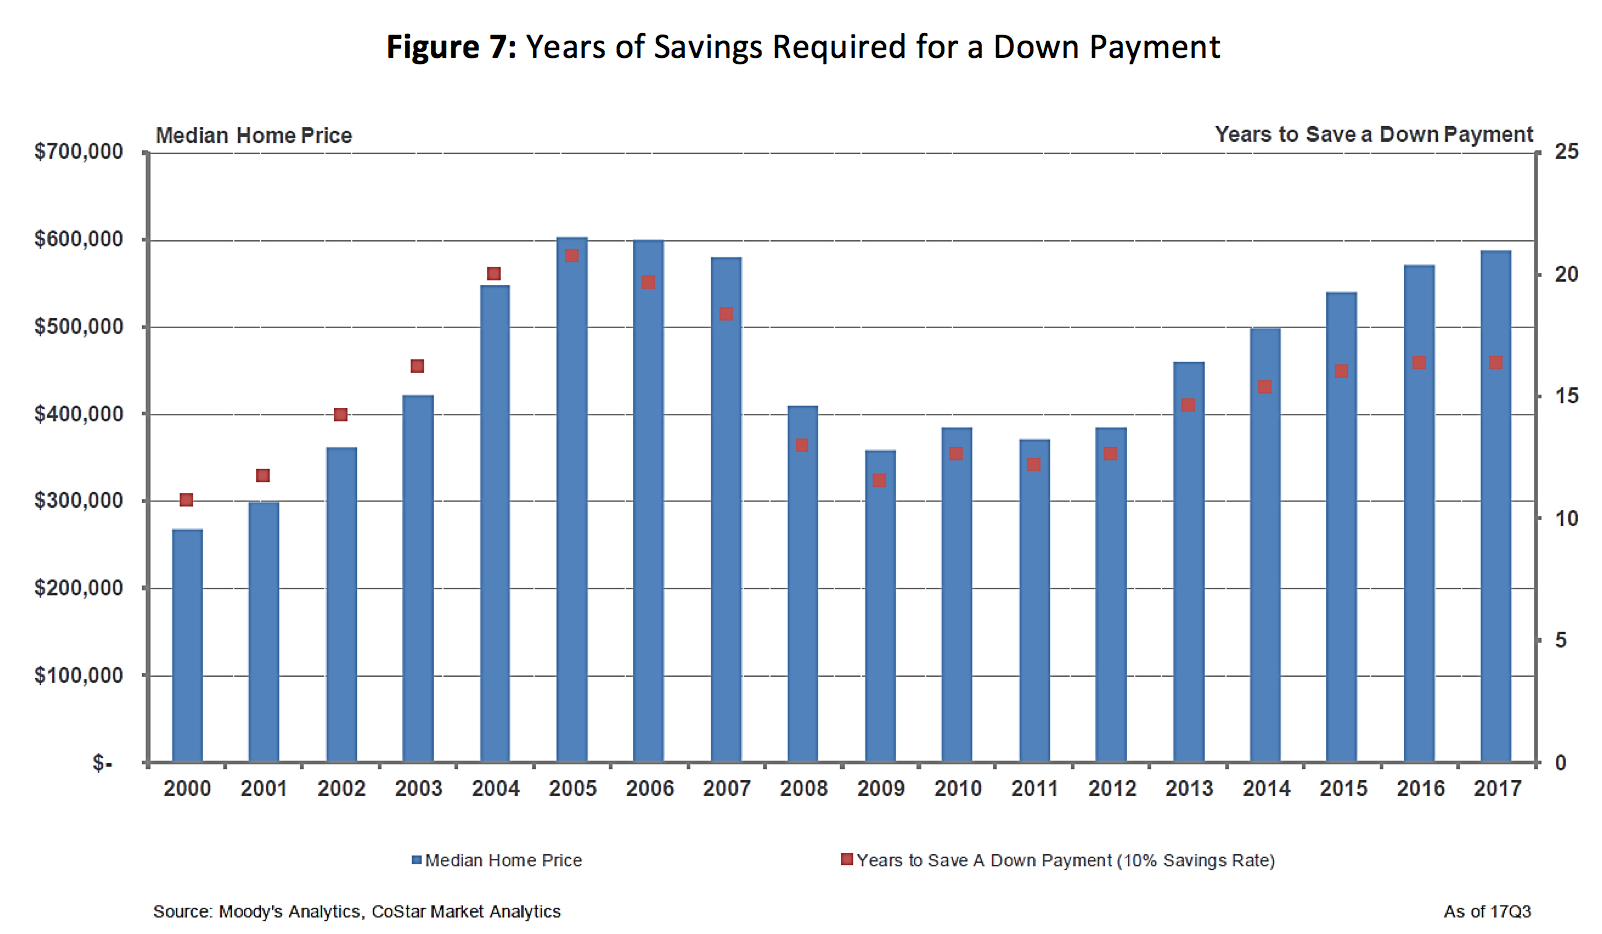
The resounding strength of the rental market has led rent growth to surpass income growth, widening to a 10%+ cumulative gap since 2010 (Figure 5). This gap has pushed rent, as a portion of household income, over 40%, with no expectation to decrease (Figure 6). CoStar estimates that with the median San Diego home price of approximately $600k and a median income of $70k, it would take 15+ years to save up for a down payment (Figure 7).
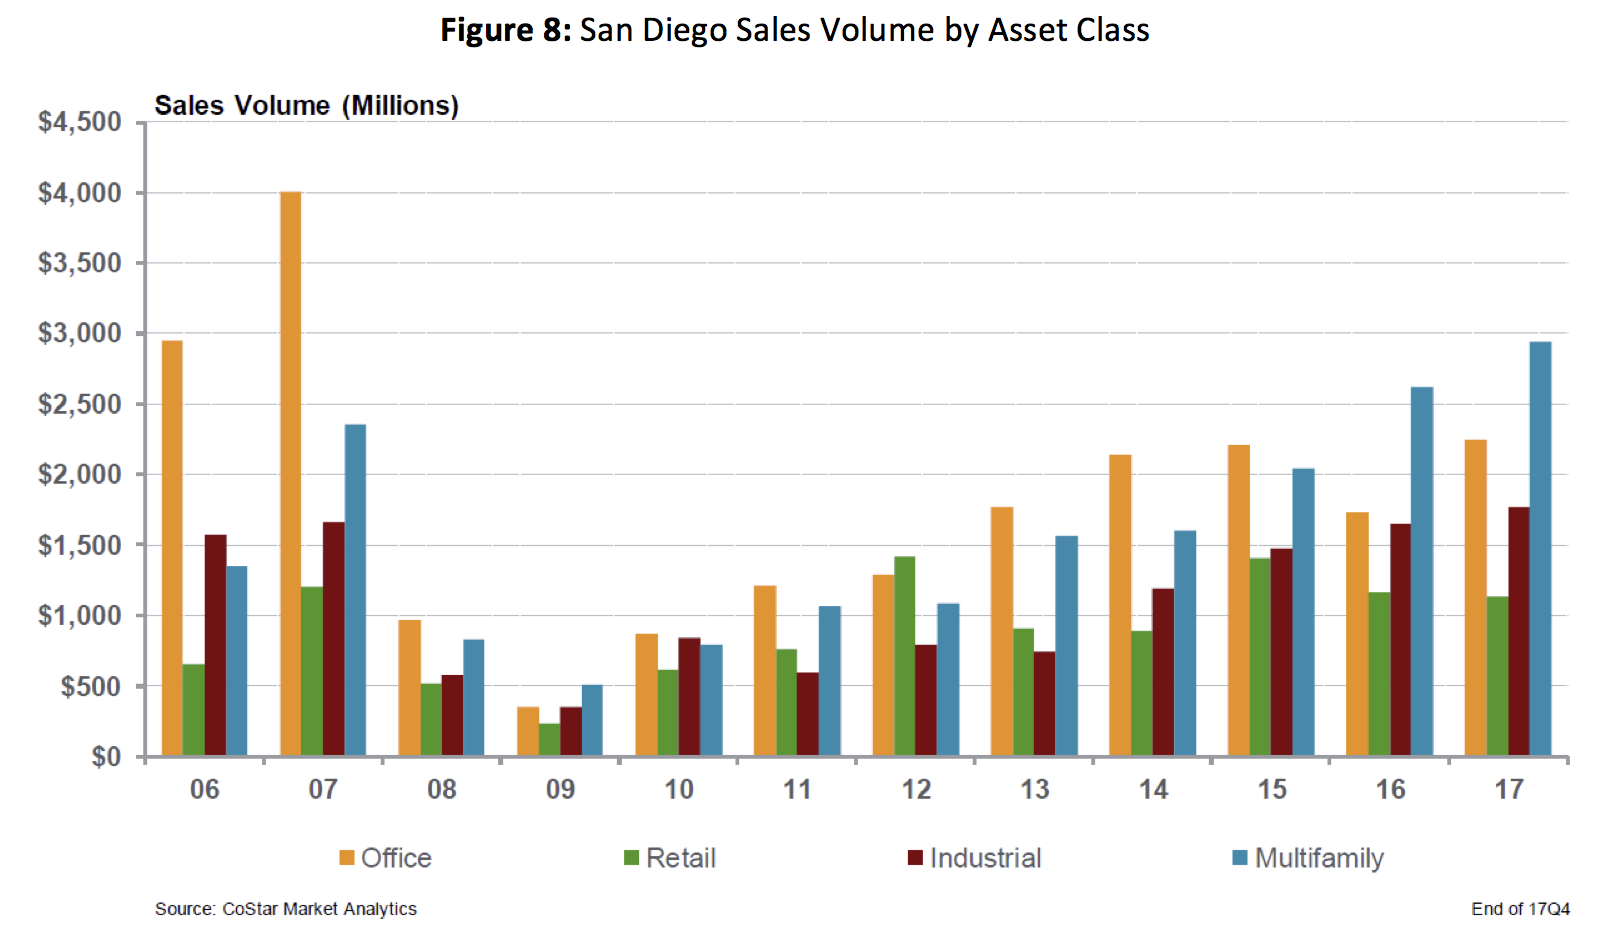
The good news, especially for developers and owners of multifamily assets, is that the investment community is taking notice. The Figure 8 below shows an increase in sales volume for various product types in San Diego, with the breakout winner being Multifamily.
Demographic Implications
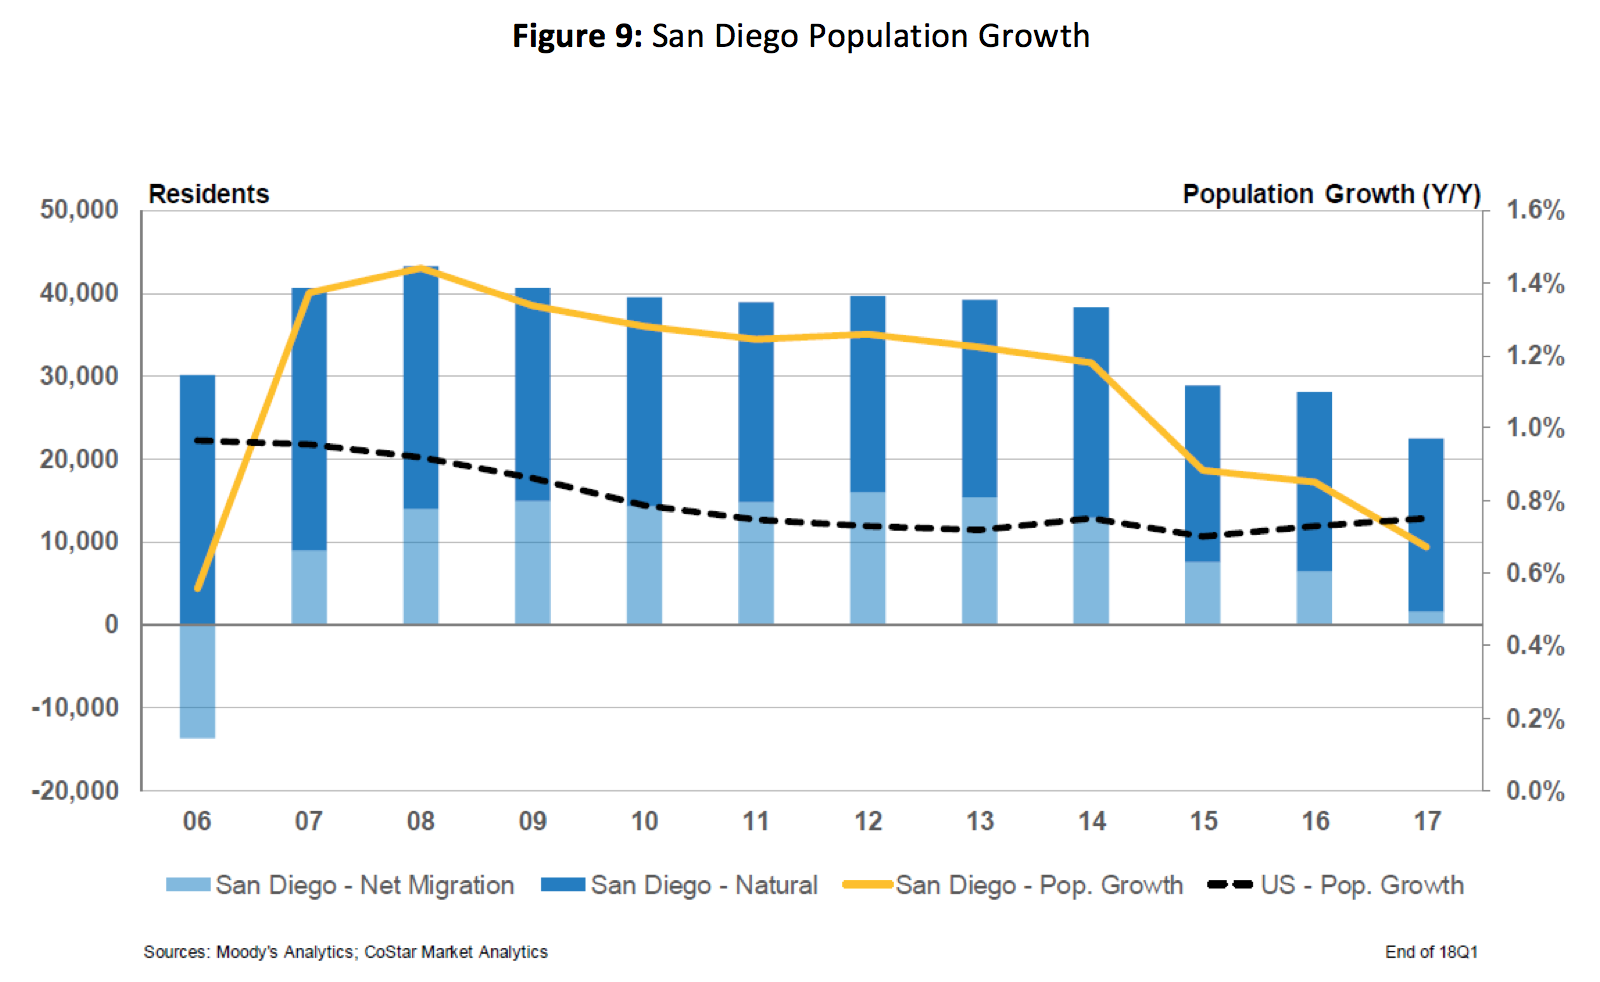
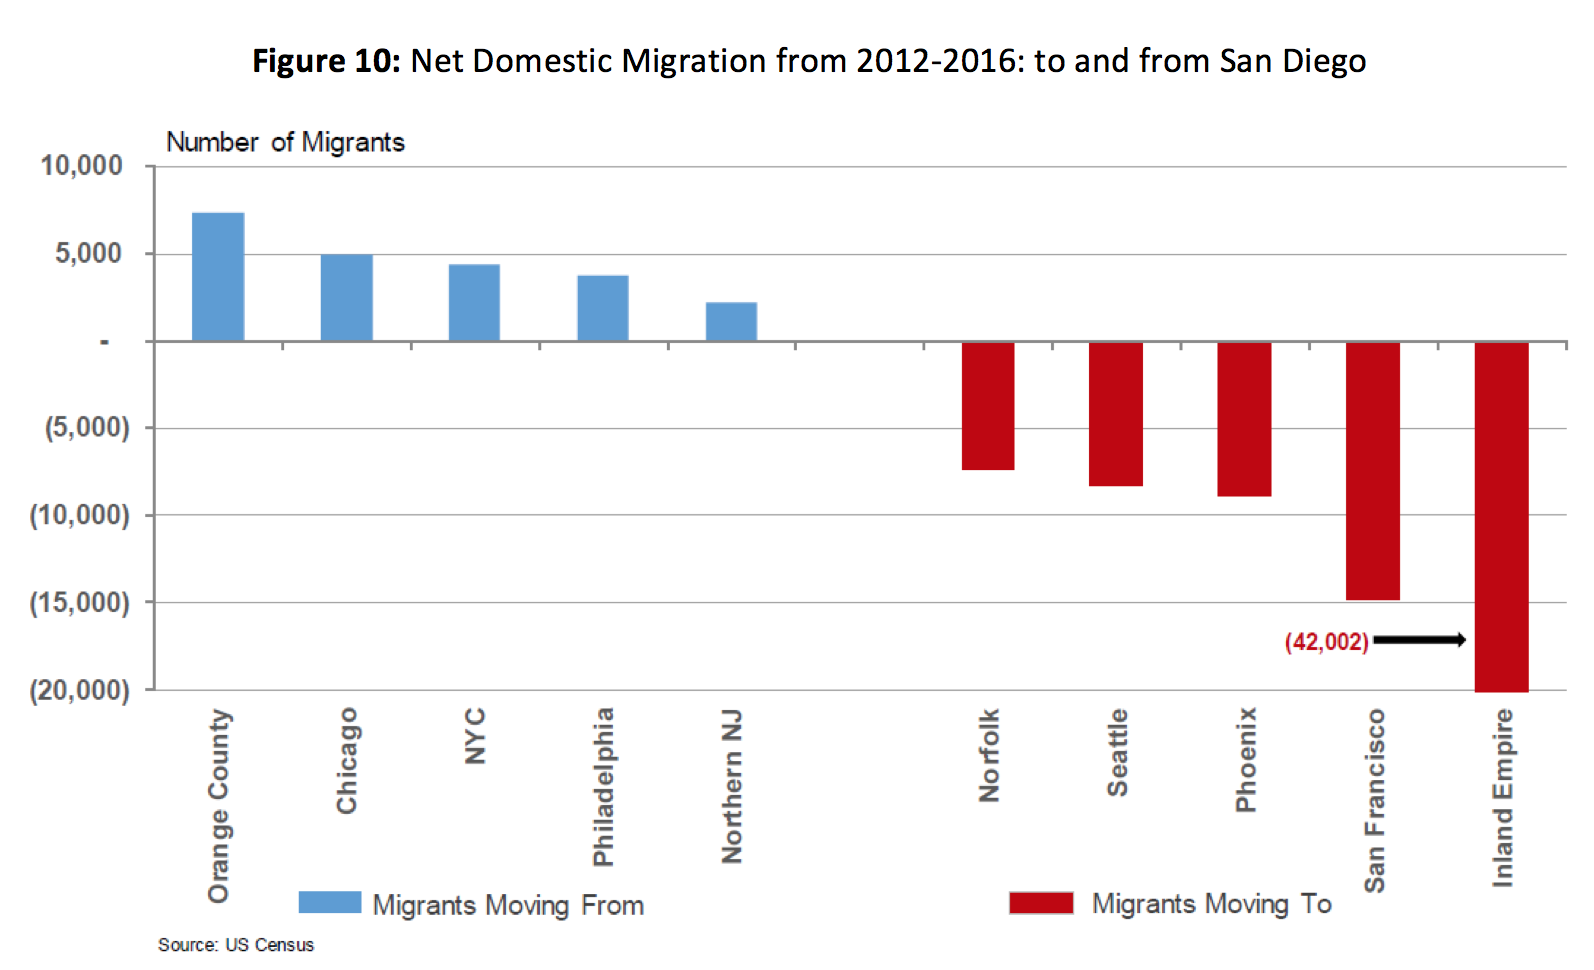
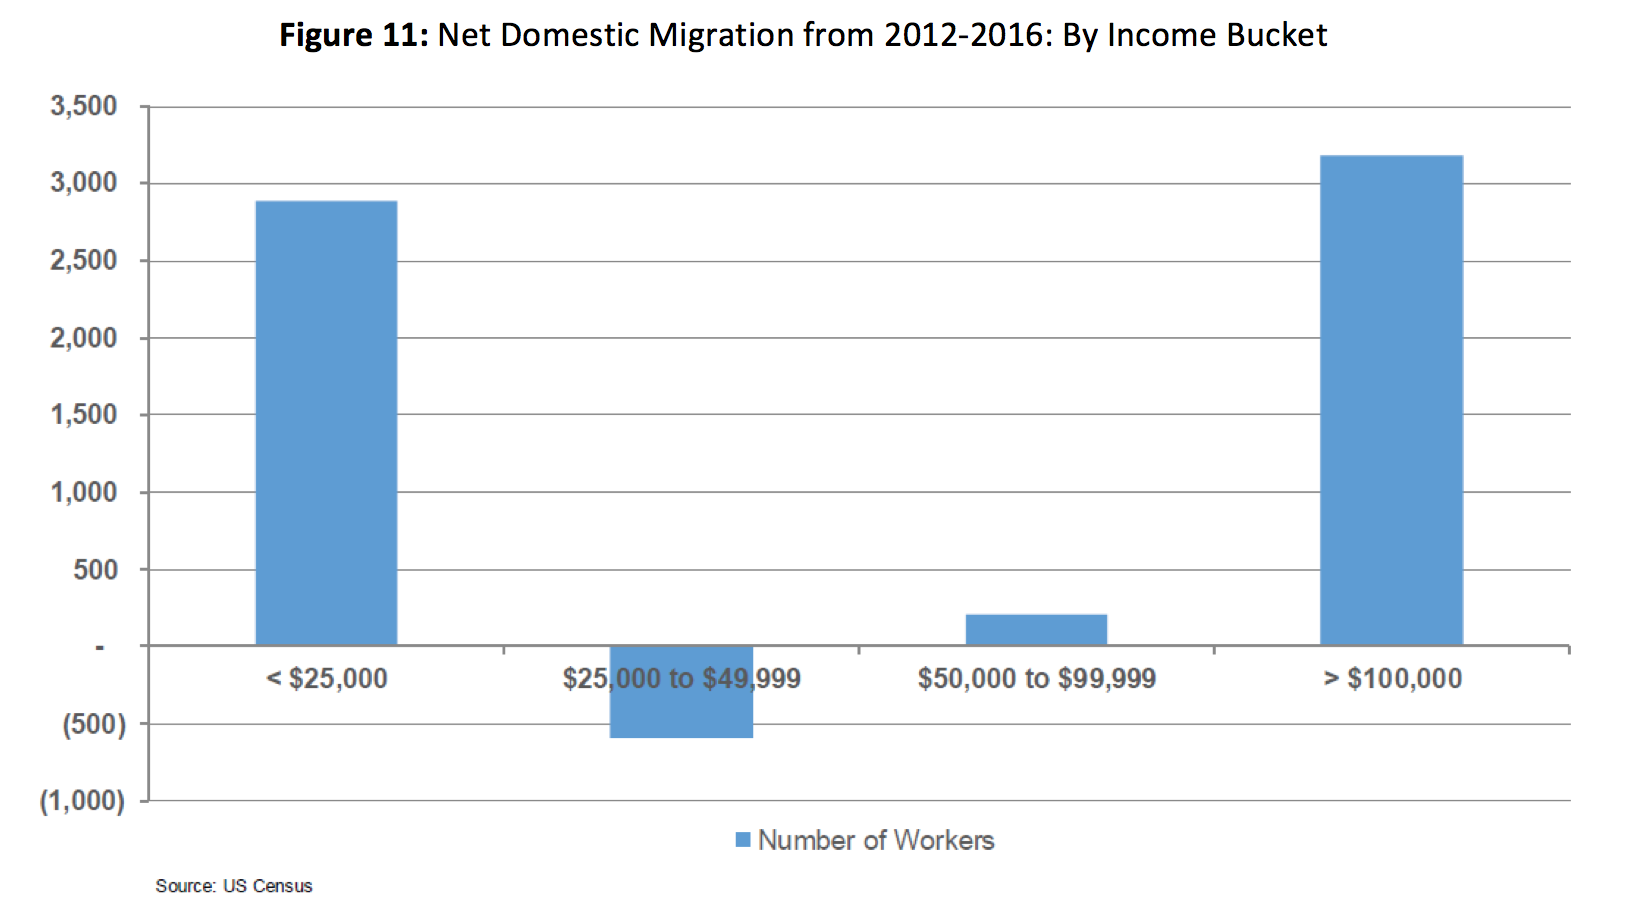
If this trend continues the effects could be polarizing. The following graphics show continued positive population growth in San Diego (Figure 9), but a declining portion of migrants vs. births (natural). Those moving to San Diego are coming from more expensive and/or crowded metros such as Orange County, NYC, and Chicago, and moving out of San Diego for stronger job markets relative to the cost of living (Figure 10). The majority of those coming to San Diego are of the lowest income bracket (unemployed) or high earners (Figure 11). The middle is being squeezed as we see a net outflow of residents in the $25k-50K income bracket.
Conclusion
With all this evidence pointing to San Diego as a remarkably active and healthy multifamily market, it seems we just cannot build enough. This presents a fantastic opportunity for developers who can navigate the regulatory landscape and for investors looking for occupied/income producing assets with projected rent growth. Unfortunately, the losers are renters and hopeful homeowners. Eventually there will be a breaking point where too many people are priced out and start leaving, however, as long as San Diego stays an enjoyable place to live, remains a more affordable option to metros such as NYC, SF, & LA, and continues to attract high-income earners, that day is far off.
